Formulation of A Prediction Index with the Help of WEKA Tool for Guiding the Stock Market Investors.
Introduction
Stock Prediction is an extremely difficult task as the stock prices are based on a variety of factors. Fundamental analysis and technical analysis are the two mechanisms that help to take decisions regarding stocks. Machine learning techniques are gaining popularity for stock price prediction. Through various experiments conducted it is feasible to test the machine learning techniques and select the ideal one for predicting stock prices (Vatsal H.Shah , 2007). Machine Learning (Mitchell, 1997) is a mature and well recognised research area of computer science mainly concerned with discovery of models , patterns and other regularities in data.
In this paper the time series forecasting technique has been applied through the forecasting plugin of WEKA. The following four methods – Linear Regression , Gaussian Process , Multilayer Perceptron and SMOreg have been used for prediction of stock prices.
Literature Review
Machine Learning (Mitchell, 1997) is a mature and well recognised research area of computer science mainly concerned with discovery of models , patterns and other regularities in data. Machine learning is divided into two approaches. The first approach is termed as the Symbolic approach which includes inductive learning of symbolic rules , decision trees or logical representations. The second approach is the statistical approach which includes instance based learning , Bayesian classifiers and support vector machines. The approaches are two but their effectivenss in learning is quite comparable (Michie , Spiegelhalter and Taylor , 1994).
According to Written and Frank (2005) data mining can be defined as “solving problems by analysing data that already exists in the databases”. To put it in a different way it can be said that the solution lies infront of you, it just needs to be analysed. Today almost all the data is in electronic form and so collating data is not the problem. Ample of data is available. The need of the hour is the analysis of the data to get the desired results which can be done through data mining.
Machine learning began with perceptrons which are know called as neural networks. (Rumelhart and McClelland , 1986),decision tree learners like ID3 (Quinlan , 1979 , 1986) and CART(Breiman et al , 1984) and rule learners like AQ (Michlaksi 1969) and INDUCE (Michalski,1980). Data mining and Knowledge Discovery in databases appeared as a recognisable research discipline in the early 1990s(Piatetsky –Shapiro and Frawley , 1991).
Online Transaction Processing and Online Analytical Processing(OLTP and OLAP) techniques could answer queries with very little turnaround time data mining addressed the “question of asking the right question” scenario. Various data mning techniques were used on a trial and error process. As the techniques and processes eveloved it gave rise to the cross-industry standard process for data mining (CRISP-DM; Chapman et al.,2000) which is a standard that will be independent of the tool , industry and the problem to be solved. It defines the crucial steps for the knowledge discovery process. (Business understanding , Data understanding , Data preparation through data cleaning and preprocessing , Data mining , Evaluation and interpretation of the results, Deployment). The various tools available for data mining include IBM intelligent data miner , SAS Enterprise Miner , WEKA , RAPID-I (formerly known as YALE), statistical analysis package R , Konstanz Information Miner (KNIME).
Objective of the Study
The main objective of the study is develop a computer based system / framework for assisting users to invest in the stock market and benefit from the same. The aim was not to develop a complete automated system but providing an indicator for the investor as a guiding factor. Reason being that a completely automated system lacks the human capability of decision making which involves different aspects including intuition, use of recent news regarding the company and its impact on the price to name a few, which surely a fully automated system will not be able to cater to.
Test Data
Time Horizon
Subprime mortgage crisis period was from 2007-2010 which was the result of defaults in subprime loans given to borrowers which started in the US but had a larger impact on all the other economies making the stock prices across the globe tumble down. The investors faith in the financial markets was shaken due to the same. For testing the data the most volatile period has been chosen. Figure 1 depicts the movement of Sensex for a period of 15 years.
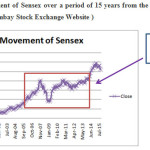 |
Figure 1: Movement of Sensex over a period of 15 years from the year 2000 to 2015 ( Source :Bombay Stock Exchange Website )
Click here to View figure
|
Period : 2006-2010
Stock Exchange
Bombay Stock Exchange–Considered to be 8th Largest exchange Globally in terms of market capitalization – Over USD 1.50 Trillion.[1]Development on the technological front – In the year 1995 the electronic trading was introduced within a time span of 50 days. This fully automated computerized mode of trading is known as BSE Online Trading (BOLT), a system both order and quote driven. BOLT was operational using screen based trading and it switched over to the direct online access facility in September 1997. In the infant stages BOLT was available to brokers of the BSE based in Mumbai through leased lines. Today, it is available all over the country and even abroad in the form of BOLT Plus. The new Trading Architecture – Eurex T7 Platform is one of the differentiating factors of the exchange.
Stocks chosen : Twenty most volatile stocks during August 2008 were decidedas the test data.
Table 1 : Most Active Securities 2008. (Source : Bombay Stock Exchange Website)
|
Sr.No.
|
Name of the Company
|
Symbol
|
Scrip code
|
Industry the company belongs to.
|
|
01
|
Reliance Capital Ltd.
|
Relcapital
|
500111
|
Finance (including NBFCs)
|
|
02
|
Reliance Industries Ltd.
|
Reliance
|
500325
|
Integrated Oil and Gas
|
|
03
|
Reliance Natural Resources Ltd.
|
RNRL
|
Suspended
Merger with Reliance Power Ltd
|
Energy
|
|
04
|
Coral Hub Limited
|
Coral Hub
|
Suspended due to penal reasons
|
IT Software Products
|
|
05
|
ICICI Bank Limited
|
ICICI BAnk
|
532174
|
Banks
|
|
06
|
Larsen and Turbo Limited
|
LT
|
500510
|
Construction and Engineering
|
|
07
|
Reliance Communications Ltd
|
Rcom
|
532712
|
Telecom Services
|
|
08
|
Reliance Infrastructure Ltd
|
Relinfra
|
500390
|
Infrastrcture
|
|
09
|
State Bank of India Ltd
|
SBIN
|
500112
|
Banks
|
|
10
|
Sel Manufacturing Co.Ltd
|
SelMcl
|
532886
|
Textiles
|
|
11
|
Tata Steel Ltd
|
Tatasteel
|
500470
|
Iron and Steel / Interm products
|
|
12
|
Reliance Petroleum Limited
|
RPL
|
532939
Merger with RNRL
|
Petrol
|
|
13
|
Bharati Airtel
|
Bharatiartl
|
532454
|
Telecom Services
|
|
14
|
Delhi Land and Finance Limited
|
DLF
|
532868
|
Realty
|
|
15
|
Bharat Heavy Electricals Limited
|
BHEL
|
500103
|
Heavy Electrical
|
|
16
|
Chambal Fertilisers and Chemicals Limited
|
Chamblfert
|
500085
|
Fertilizers
|
|
17
|
Axis Bank Limited
|
AXISBANK
|
532215
|
Banks
|
|
18
|
Essar Oil Limited
|
Essaroil
|
500134
|
Integrated Oil and Gas
|
|
19
|
Housing Development and Infrastructure Limited
|
HDIL
|
532873
|
Realty
|
|
20
|
Jaiprakash Associates Limited
|
JPAssoc
|
532532
|
Construction and Engineering
|
|
2211
|
Infosys Limited
|
Infy
|
500209
|
IT Construction and Software
|
|
22
|
Ranbaxy Laboratories Limited
|
Ranbaxy
|
500359
|
Pharma
|
|
23
|
Housing Development Finance Corp Ltd
|
HDFC
|
500010
|
Housing Finance
|
Testing Matrix
The testing matrix was developed by allocating the stocks on a quarterly basis in order of selection to avoid any bias.
Table 2: Testing Matrix
|
Year
|
Quarter
|
Company
|
|
2006 -2007
|
Q1
April , May , June
|
a.Reliance Capital Ltd.
b.Reliance Industries Ltd.
c..ICICI Bank Limited
d..Larsen and Turbo Limited
e. Reliance Communications Ltd
|
|
2007-2008
|
Q2
July , August , September
|
a.Reliance Infrastructure Ltd
b.State Bank of India Ltd
c.Sel Manufacturing Co.Ltd
d.Tata Steel Ltd
e. Bharati Airtel Limited
|
|
2008-2009
|
Q3
October , November , December
|
a.Delhi Land and Finance Limited
b.Bharat Heavy Electricals Limited
c.Chambal Fertilisers and Chemicals Limited
d.Axis Bank Limited
e.Essar Oil Limited
|
|
2009-2010
|
Q4
January , February , March
|
a.Housing Development and Infrastructure Limited
b.Jaiprakash Associates Limited
c Infosys Limited.
d.Ranbaxy Laboratories Limited
e.HDFC
|
Tool and Methods used : Forecasting plugin of the WEKA tool.
Four methods were implemented through the tool.
- LinearRegression
- Gaussian process
- Multilayer Perceptron
- SmoReg
Weka
WEKA implements many machine learning methods. Testing one random stock it was found that the results are helpful to develop the Prediction Indicator (PreID) which will act as a guide for investors. Though time consuming as 20 experiments were conducted to establish the reliability, WEKA was chosen for development of PreID.
The Weka project has received funding from the Government of New Zealand from 1993. The original funding application stated the project’s goal as
“The programme aims to build a state of art facility for developing techniques of machine learning and investigating their application in key areas of the New Zealand economy. Specifically we will create a workbench for machine learning , determine the factors that contribute towards its successful application in the agriculture industries and develop new methods of machine learning and ways of assessing their effectiveness .“
After development of the interface and infrastructure of the workbench the WEKA acronym was coined and the Attribute Relation File Format (ARFF) used by the system was effectively created.
Weka is a collection of machine learning algorithm for data mining tasks. (Data mining is the process of discovering insightful, interesting and novel patterns as well as descriptive , understandable and predictive models from large scale data[1]. Weka stands for Waikato Environment for Knowledge Analysis. It is a free software written in Java developed at the University of Waikato. It is available as an open source through GNU General Public License. It has a comprehensive collection of modelling techniques supported by data pre processing. An user interface in the form of explorer can be used with supporting knowledge framework for data mining tasks.[1]Data mining and analysis (Fundamental Concepts and Algorithms) Mohammed J Zaki and Wagner Meira Jr.
Time Series Forecasting
In the versions 3.7.3 and above Weka has a dedicated time series environment. This environment can be successfully used for developing, visualising and evaluating forecasting models. This chapter shall show implementation of forecasting models on stock market prices for future predictions. A time series model is preferred in the following situations – a)there are many factors affecting the concerned variable and information about such variables is limited b) the quantity / volume of data is very high and c) the main objective is predicting or a short period of time. The time series model is said to be stationery if there is no systematic change in variance and if strictly periodic variations are removed (Chatfield). This holds true especially with seasonal based spikes / observations. It case of a non-stationery time series it can be divided into stochastic and deterministic. The stochastic models generally holds true for economic processes, climate changes where randomness forms the base. The deterministic model generally has some physical explanation for a trend or a seasonal fluctuation. Time Series Analysis by the Princeton University Press (JamesD.Hamilton) describes the mathematical part of time series in depth. In this chapter the application of these mathematical models have been used through the forecasting plug in avaialbe through Pentaho.
Data Analysis and Inferences
The Mean Absolute Error and Root MEAN Square Error have been calculated to analyse the error in prediction of the forecasted prices.
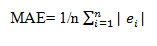
Mean Absolute Error (MAE)
It measures the magnitude of the error in a series of forecasts. It ignores the direction. Also it gives equally weightage to each individual difference making it a linear score. It is a toll used widely in model evaluations. n their paper evaluated MAE and Root Mean Square Error (RMSE) in the most precise manner and have tried to interpreted their meanings and usage in depth. They Support the use of RMSE though Willmott and Matsuura (2005) had raised some concerns on the use of RMSE.
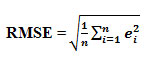
Root Mean Square Error (RMSE)
This is a quadratic squaring rule which measures the average magnitude of the error. The difference between the forecasted and the observed value is each squared and then averaged over the sample. Square root of the sample is taken. The squaring ensures higher weightage to the large errors. (In stock market prediction this will be appreciated for better accuracy).
While testing the results of the experiments conducted through the WEKA environment, both MAE and RMSE have been used for evaluating the model. One major advantage of the use of RMSE as cited by T.Chai and R.R.Daxler (2014) is RMSE avoids absolute value which helps to evaluate the model better.
The errors computed in WEKA show an increase with each step. The reason being that the next step calculation contains the previous forecast which already has an error embedded within it being a forecast.
Results
- The analysis reflected that the difference between the actual and predicted prices was fairly good for eighteen stocks. Prediction of two stocks did not produce good results.
- Linear Regression model took the least time to build as compared to the other models and SMOreg took the maximum time to build the model.
- The Gaussian and SMOreg process gave more accurate results. Linear Regression and Multilayer Perceptron results were ranked lower on the accuracy parameter.
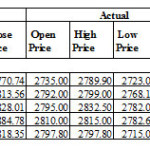
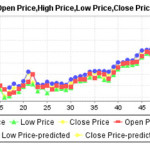
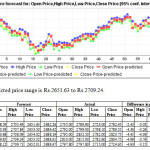
- HDFC ( Gaussian Process – Quarter four) – The range of difference in percentage is zero for the open price. This was the last experiment and it has given 100% accuracy result for the open price prediction on day one. This is the only experiment that has given 100%results.
Reliance Communications Limited and Essar Oil (All four methods – Linear Regression , Gaussian process , Multilayer Perceptron and SmoReg and all four quarters of the Indian Financial Year) – The results of all the four methods on two stocks namely Reliance Communications Limited and Essar Oil Limited did not give good results. The difference between the actual and predicted prices was very high. The forecasted prices were very high as compared to the actual prices. The importance of having a stop loss mechanism in the framework is reiterated with the results.
Weka is an open source software that uses Linear Regression , Gaussian process , Multilayer Perceptron and SmoReg methods for analysis. Mathematically also it would give the same result as the software uses the mathematical base itself. A black box approach has been followed here where the input and output are being analysed by using WEKA for the mathematical calculations.
Formulation of Prediction Index ( Preid)
The market movement needs to be measured for analysing performance of the stock. As analysed in the survey, investors find the market risky. Risk cannot be eliminated but investor can surely be made aware of the stock’s performance in future. Keeping this framework in mind a prediction index has been developed. While computing the index weights have been assigned as per the time series to the closing price. Also the index is based on the forecast done through WEKA.
Prediction Index Computation assuming one stock of the company is held by the investor is as below. It has been computed by the weighted average method used on the forecasted prices. Weights have been assigned based on the time horizon. The accuracy percentage is computed to measure the forecasting accuracy provided by WEKA. The below index value is computed on the basis of the Gaussian process.
Table 2
|
Quarter
|
Stock
|
Year
|
|
Index value
Basis Points
|
|
Accuracy
|
|
Q1
|
Reliance Industries Ltd
|
2006
|
Original
|
835.18
|
|
|
|
|
|
|
Last
|
1,019.02
|
|
|
|
|
|
|
Forecast
|
977.99
|
Decline
|
|
|
|
|
|
Diff
|
41.03
|
|
|
|
|
|
|
Actual
|
1,075.23
|
|
91%
|
|
|
|
|
|
|
|
|
|
Q2
|
Tata Steel Ltd
|
2007
|
Original
|
617.88
|
|
|
|
|
|
|
Last
|
794.61
|
|
|
|
|
|
|
Forecast
|
747.70
|
Decline
|
|
|
|
|
|
Difference
|
46.91
|
|
|
|
|
|
|
Actual
|
919.50
|
|
81%
|
|
|
|
|
|
|
|
|
|
Q3
|
Axis Bank Ltd
|
2008
|
Original
|
674.25
|
|
|
|
|
|
|
Last
|
500.13
|
|
|
|
|
|
|
Forecast
|
484.63
|
Decline
|
|
|
|
|
|
Difference
|
15.50
|
|
|
|
|
|
|
Actual
|
539.40
|
|
90%
|
|
|
|
|
|
|
|
|
|
Q4
|
HDFC Ltd
|
2009
|
Original
|
2,646.06
|
|
|
|
|
|
|
Last
|
2,631.29
|
|
|
|
|
|
|
Forecast
|
2,775.25
|
Rise
|
|
|
|
|
|
Difference
|
-143.96
|
|
|
|
|
|
|
Actual
|
2662.87
|
|
96%
|
The range of difference in percentage is zero for the open price. This was the last experiment and it has given 100% accuracy result for the open price prediction on day one. This is the only experiment that has given 100%results. The range of difference in percentage is 0.00% to 4.53%.
|
Evaluation of the forecast – HDFC
|
|
|
|
|
|
|
|
1 step ahead
|
2 step ahead
|
3 step ahead
|
4 step ahead
|
5 step ahead
|
|
Linear Regression
|
|
|
|
|
|
|
Open Price
|
|
|
|
|
|
|
N
|
53
|
52
|
51
|
50
|
49
|
|
Mean absolute error
|
13.445
|
24.7532
|
29.7201
|
35.5976
|
45.8024
|
|
Root mean squared error
|
16.9378
|
33.2592
|
37.82
|
44.3329
|
56.1438
|
|
High Price
|
|
|
|
|
|
|
N
|
53
|
52
|
51
|
50
|
49
|
|
Mean absolute error
|
17.6064
|
25.3619
|
30.9794
|
36.5881
|
46.4393
|
|
Root mean squared error
|
21.1591
|
33.8358
|
40.6815
|
46.5541
|
54.2243
|
|
Low Price
|
|
|
|
|
|
|
N
|
53
|
52
|
51
|
50
|
49
|
|
Mean absolute error
|
15.0158
|
22.4593
|
28.0472
|
35.337
|
44.2954
|
|
Root mean squared error
|
19.3446
|
29.6638
|
35.3902
|
44.7658
|
54.7794
|
|
Close Price
|
|
|
|
|
|
|
N
|
53
|
52
|
51
|
50
|
49
|
|
Mean absolute error
|
19.0453
|
27.0552
|
35.8737
|
44.729
|
49.1259
|
|
Root mean squared error
|
24.4963
|
35.7682
|
44.5024
|
55.5436
|
60.7565
|
The MAE and RMSE value is highest for computation of the close price being 19.0453 (MAE) and 24.4963 (RMSE) for day one prediction.
|
Evaluation of the forecast – HDFC
|
|
|
|
|
|
|
|
1 step ahead
|
2 step ahead
|
3 step ahead
|
4 step ahead
|
5 step ahead
|
|
Multilayer Perceptron
|
|
|
|
|
|
|
Open Price
|
|
|
|
|
|
|
N
|
53
|
52
|
51
|
50
|
49
|
|
Mean absolute error
|
20.0032
|
50.7924
|
58.7218
|
67.7724
|
62.2628
|
|
Root mean squared error
|
25.4623
|
57.7831
|
64.9863
|
73.7773
|
69.6545
|
|
High Price
|
|
|
|
|
|
|
N
|
53
|
52
|
51
|
50
|
49
|
|
Mean absolute error
|
21.6696
|
55.2902
|
66.9127
|
69.9507
|
54.5885
|
|
Root mean squared error
|
25.5134
|
58.5753
|
71.2105
|
76.8131
|
63.3157
|
|
Low Price
|
|
|
|
|
|
|
N
|
53
|
52
|
51
|
50
|
49
|
|
Mean absolute error
|
26.4178
|
56.5628
|
66.1668
|
75.088
|
51.8592
|
|
Root mean squared error
|
30.6081
|
61.857
|
71.2813
|
80.3652
|
59.8302
|
|
Close Price
|
|
|
|
|
|
|
N
|
53
|
52
|
51
|
50
|
49
|
|
Mean absolute error
|
52.5351
|
79.3283
|
94.6178
|
92.807
|
73.3666
|
|
Root mean squared error
|
57.1108
|
83.9703
|
99.5062
|
102.276
|
84.119
|
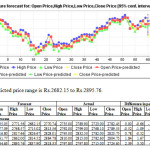
For all the instances the forecasted prices are lower than the actual prices so we can call this a conservative forecast. The range of difference in percentage is 0.41% to 6.79%.
Similarly Prediction indices for Open Price ,High Price and Low Price can be computed. Computation of the PreID marks the end of the study conducted during this study. Also a stop loss mechanism should always be exercised as a precautionary measure in case of unwarranted situations, to quote the Flash Crash[1]as an example.
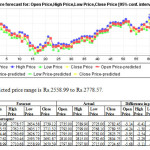
The range of difference in percentage is 1.32% to 4.99%. In all the instances the forecasted prices are lower than the actual prices.
|
Evaluation of the forecast – HDFC
|
|
|
|
|
|
|
|
1 step ahead
|
2 step ahead
|
3 step ahead
|
4 step ahead
|
5 step ahead
|
|
SMOreg
|
|
|
|
|
|
|
Open Price
|
|
|
|
|
|
|
N
|
53
|
52
|
51
|
50
|
49
|
|
Mean absolute error
|
26.2756
|
34.5181
|
39.6782
|
42.3616
|
44.6451
|
|
Root mean squared error
|
34.295
|
43.7984
|
49.8633
|
54.1523
|
56.4474
|
|
High Price
|
|
|
|
|
|
|
N
|
53
|
52
|
51
|
50
|
49
|
|
Mean absolute error
|
27.5766
|
34.6162
|
39.2698
|
41.9741
|
43.3769
|
|
Root mean squared error
|
36.7542
|
45.2719
|
50.1008
|
53.321
|
54.5421
|
|
Low Price
|
|
|
|
|
|
|
N
|
53
|
52
|
51
|
50
|
49
|
|
Mean absolute error
|
26.8539
|
34.8737
|
40.4179
|
42.9858
|
43.5055
|
|
Root mean squared error
|
35.5407
|
43.8863
|
49.7503
|
52.9218
|
53.7829
|
|
Close Price
|
|
|
|
|
|
|
N
|
53
|
52
|
51
|
50
|
49
|
|
Mean absolute error
|
33.1777
|
39.6246
|
43.5137
|
45.6101
|
45.7919
|
|
Root mean squared error
|
43.0083
|
50.2365
|
54.9176
|
57.4246
|
58.1713
|
The MAE and RMSE value is highest for computation of the close price being 33.17777(MAE) and 43.0083 (RMSE) for day one prediction.
Conclusion
Marking the end of the research with a prediction indicator a value addition for the current literature available on diversification of risk through multiple investment avenues has been sought. Using WEKA the machine learning techniques have been used which have given good results. Twenty experiments were time consuming but have surely contributed to the assurance of the prediction capability.
The tussle between the efficient market hypothesis theory and the algo traders (traders using algorithms for executing orders for better results) can be put to rest. Impossible to predict with hundred percent accuracy level but prediction above ninety percent accuracy with a limiting factor for protection can be well appreciated.
To quote an except from Graham and Dodd’s Security Analysis , “It follows that once an investor pays a substantial amount for the growth factor , he is inevitably assuming certain kinds of risk viz that the growth will be less than he anticipates , that over the long pull he will have paid too much for what he gets , that for a considerable period the market will value the stock less optimistically than he does.”
The above quote beautifully explains the fact that any approach towards investing has risk involved. Risk cannot be eliminated but can surely be minimised. Also risk should be used to one’s benefit for good returns assuming the risk-return paradigm holds true. Stock market investing is a world of opportunities left for the investor to be explored through tools and techniques suiting one’s risk appetite.
Further Research
The academic research about stock price prediction conducted as a part of this study leaves a good amount of scope for future research in this area.
First, from the academic point of view , formulating practice into theory is required. In the academic context the fundamental analysis and the technical indicators are well established, but trading algorithms are more popular in practice than in the academia. By incorporating formal theories about the same these algorithms can also be made popular in the academia. There are many algorithms used by brokerage houses and traders which are confidential in nature. These algorithms being an intellectual property right is difficult to be bought into the literature fully, but atleast few of them which may be shared by them should be incorporated.
One observation during the experiments was that as the period increased the results were getting affected. Further research can be carried out to increase the time horizon for prediction. Time horizon may be increased by – changing the tool used for prediction, applying the same tool with more additional factors under consideration or using a new theoretical base for prediction.
Future research work will surely refine and verify the current research conducted. It may also add some extra dimensions making the research work more refined.
Limitations
The index has been developed for small investors. Views of brokerage house and Investment banks employees have not been considered. The reason was a detailed thought process evolving the framework was considered keeping the end user and his/her expectations in mind. If their views are studied a new dimension can be added to the said framework.
Also brokerage and securities transaction tax has not been considered while computing the profit as only gross profit has been considered.
While acknowledging these limitations, it can still be said beyond doubt that research exhibits an effective comprehension of the investor preferences. Accordingly the study authenticates the developed framework.
Illustration – Results of the last experiment conducted.
Experiment No. 20 – Housing Development Finance Co-op Ltd (HDFC)
Housing Development Finance Co-opLimited‘sshare has a face value of 2 Rs. While pre-processing the data in WEKA it was observed that the stock price ranged between Rs.2300– Rs.2759 during the fourth quarter of 2009-10
HDFC– Linear Regression
References
- Allen, F. & Karjalainen, R., 1999. Using genetic algorithms to find technical trading rules. Journal of Financial Economics, 51, pp.245–271.
CrossRef
- Almgren, R. & Chriss, N., 2006. Optimal portfolios from ordering information. Journal of risk, 9(1), pp.1–48.
CrossRef
- Barry Jhonson, 2010. Algorithmic Trading & DMA.pdf,
- Biais, B., Foucault, T. & Moinas, S., 2015. Equilibrium fast trading. Journal of Financial Economics, 116(2)
- pp.292–313. Available at: http://linkinghub.elsevier.com/retrieve/pii/S0304405X15000288.
- Bollen, J., Mao, H. & Zeng, X., 2011. Twitter mood predicts the stock market. Journal of Computational Science, 2(1), pp.1–8. Available at: http://dx.doi.org/10.1016/j.jocs.2010.12.007.
CrossRef
- Brogaard, J., Hendershott, T. & Riordan, R., 2011. High Frequency Trading and Price Discovery. Available at SSRN 1928510, p.45. Available at: http://papers.ssrn.com/sol3/papers.cfm?abstract_id=1928510.
- Brogaard, J.A., 2010. High Frequency Trading and its Impact on Market quality. Working Paper.
- Chaboud, Alain , Chiquoine Benjamin , Erik Hjalmarsson, C.V., Rise of the Machines : Algorithmic Trading in the Foreign Exchange Market stimulate discussion and critical comment . References in publications to International Rise of the Machines : Algorithmic Trading in the Foreign Exchange Market. International Finance Discussion Paper, (980).
- Cliff, D. & Bruten, J., 1997. Less Than Human : Simple adaptive trading agents for CDA markets. , pp.1–6.
- D. Michie, D.J. Spiegelhalter, C.C. Taylor , Machine Learning, Neural and Statistical Classification , February 17, 1994 , “StatLog” project which lasted from 1990 to 1993
- Darie MOLDOVAN , Mircea MOCA, S.N., 2011. A Stock Trading Algorithm Model Proposal, based on Technical Indicators Signals. Informatica Economica, 15(1), pp.183–188.
- Degryse Frank de Jong Vincent van Kervel, H. et al., 2011. The impact of dark trading and visible fragmentation on market quality. , (November). Available at: http://ssrn.com/abstract=1815025.
- Domowitz, I., Ave, M. & Yegerman, H., 2005. Measuring and interpreting the performance of broker algorithms. Algorithmic Trading: a Buyside handbook.
- Eisner, J., 2002. An interactive spreadsheet for teaching the forward-backward algorithm. Proceedings of the ACL02 Workshop on Effective tools and methodologies for teaching natural language processing and computational linguistics, 1(July), pp.10–18. Available at: http://portal.acm.org/citation.cfm?doid=1118108.1118110.
- Foucault, T., Kozhan, R. & Tham, W.W., 2014. Toxic Arbitrage. Working Paper, 2014(September 2012), pp.1–56.
- Gomber, P. & Gsell, M., Center for Financial Studies. Center for Financial Studies, 49.
- Gupta, A. & Dhingra, B., 2012. Stock market prediction using Hidden Markov Models. 2012 Students Conference on Engineering and Systems, pp.1–4. Available at: http://ieeexplore.ieee.org/lpdocs/epic03/wrapper.htm?arnumber=6199099.
- Hendershott, T. & Riordan, R., 2011. Algorithmic Trading and Information. 4th Annual Microstructure Conference, New York University.
- Ian H.Witten and Eibe Frank , Data Mining : Practical Machine Learning Tools and Techniques with Java Implementatios , Morgan Kauffman Publishers , pgs 416 cited in a review by James Geller , New Jersey , Institute of Technology.
- John J.Murphy, 1999. Technical Analysis of the Financial Markets,
- K.K.Sureshkumar, 2011. An Efficient Approach to Forecast Indian Stock Market Price and their Performance Analysis. International Journal of Computer Application, 34(5), pp.44–49.
- Kakade, S.M., Kearns, M. & Ortiz, L.E., 2004. Competitive Algorithms for VWAP and Limit Order Trading. ACM.
CrossRef
- Kamalakannan, R.S.P., 2014. An Approach to Analyze Stock Market Using Clustering Technique. International Journal of Science and research, 3(10), pp.2234–2237.
- Kavitha, G., Udhayakumar, a & Nagarajan, D., 2013. Stock Market Trend Analysis Using Hidden Markov Models. arXiv preprint arXiv:1311.4771. Available at: http://arxiv.org/abs/1311.4771.
- Kirilenko, A. & Kyle, A.S., 2011. The Flash Crash : The Impact of High Frequency Trading on an Electronic Market ∗.
- Kirilenko, A.A., Lo, A.W. & Kirilenko, A., 2013. Moore’ s Law versus Murphy’ s Law: Algorithmic Trading and Its Discontents. the Journal of Economic Perspectives, 27(2), pp.51–72.
- Kissell, R., 2005. Understanding the Profit and Loss Distribution of Trading Algorithms. Institutional Investor , Guide to Algorithmic Trading , Spring 2005, pp.1–13.
- Kissell, R.L., Freyre-sanders, A. & Carrie, C., 2005. The future of algorithmic trading.
- Kumar, M., 2013. A Study of Customers ’ Preference towards Investment in Equity Shares and Mutual Funds. International Journal of Education and Physchological Research, 2(2), pp.95–100.
- Lo, A.W., Mamaysky, H. & Wang, J., 2000. Foundations of Technical Analysis : Computational Algorithms , Statistical Inference , and Empirical Implementation. Journal of Finance, LV(4). Available at: http://web.mit.edu/people/wangj/pap/LoMamayskyWang00.pdf.
CrossRef
- Majumder, M. & Hussian, MD, a, 2010. Forcasting of Indian Stock Market Index Using Artificial Neural Network. Nseindia.Com, pp.1–21.
- Nobakht, B., Joseph, C. & Loni, B., 2012. Stock market analysis and prediction using hidden markov models. Student Conference on Engg …, pp.2–7. Available at: http://ftse.googlecode.com/svn-history/r34/trunk/nl.liacs.dbdm.ftse/docs/report/0938505BehroozNobakht_0953083CarlDippel_4040260BabakLoni_4.pdf.
- Norms, I. & Requirements, D., 2004. PART ONE : POLICIES AND PROGRAMMES SEBI functions within the legal framework of. , pp.1–24.
- Onegin, E., Chapter 6 Hidden Markov and Maximum Entropy Models,
- Palmliden, B.F., 2011. Time-Weighted Average Price ( TWAP ): A New Approach. Trade Station Labs, (31), pp.1–7.
Raghavendra, S., Paraschiv, D. & Vasiliu, L., 2008. A Framework for Testing Algorithmic Trading Strategies. Working Paper No.0139 , Dept of
- Economics , National University of Ireland , Galway, (0139), pp.1–25.
- S K Rao, 2006. Algorithmic Trading : Pros and Cons. Published by Tata Consultancy Services. Schumaker, R. & Chen, H., 2006. Textual Analysis of Stock Market Prediction Using Financial News Articles. AMCIS 2006 Proceedings, p.paper 185.
- Tom.M.Mitchell , Book on Machine Learning , 1997 , Tata Mcgraw Hill
- Vatsal H.Shah , Foundations of Machine Learning, Essay , Spring 2007 , New York University www.timesofindia.com ,www.economictimes.indiatimes.com , www.sebi.gov.in
Accessed during the entire research for any latest updates on stock market regulations.

This work is licensed under a Creative Commons Attribution 4.0 International License.