Classical and Fuzzy Based Image Enhancement Techniques for Banana Root Disease Diagnosis: A Review and Validation
D. Suryaprabha1, J. Satheeshkumar2 and N. Seenivasan3*
1School of Post Graduate Studies, Tamil Nadu Agricultural University, Coimbatore-641003, Tamil Nadu, India
2Department of Computer Applications, School of Computer Science and Engineering, Bharathiar University, Coimbatore, 641 046 Tamil Nadu, India.
3Department of Plant Pathology, Agricultural College and Research Institute, Madurai-625104, Tamil Nadu, India.
Corresponding Author E-mail: seeni_nema@yahoo.com
DOI : http://dx.doi.org/10.13005/ojcst13.01.05
Article Publishing History
Article Received on : 7 April 2020
Article Accepted on : 19 May 2020
Article Published : 19 May 2020
Plagiarism Check: Yes
Reviewed by: S. K. Jayanthi
Second Review by: Naveen Kumar
Final Approval by: Dr Mihai Lungu
Article Metrics
ABSTRACT:
A vital step in automation of plant root disease diagnosis is to extract root region from the input images in an automatic and consistent manner. However, performance of segmentation algorithm over root images directly depends on the quality of input images. During acquisition, the captured root images are distorted by numerous external factors like lighting conditions, dust and so on. Hence it is essential to incorporate an image enhancement algorithm as a pre-processing step in the plant root disease diagnosis module. Image quality can be improved either by manipulating the pixels through spatial or frequency domain. In spatial domain, images are directly manipulated using their pixel values and alternatively in frequency domain, images are indirectly manipulated using transformations. Spatial based enhancement methods are considered as favourable approach for real time root images as it is simple and easy to understand with low computational complexity. In this study, real time banana root images were enhanced by attempting with different spatial based image enhancement techniques. Different classical point processing methods (contrast stretching, logarithmic transformation, power law transformation, histogram equalization, adaptive histogram equalization and histogram matching) and fuzzy based enhancement methods using fuzzy intensification operator and fuzzy if-then rule based methods were tried to enhance the banana root images. Quality of the enhanced root images obtained through different classical point processing and fuzzy based methods were measured using no-reference image quality metrics, entropy and blind image quality index. Hence, this study concludes that fuzzy based method could be deployed as a suitable image enhancement algorithm while devising the image processing modules for banana root disease diagnosis.
KEYWORDS:
Fuzzy contrast enhancement methods; fuzzy intensification operator; fuzzy if-then rules method; Image enhancement; no – reference image quality index
Copy the following to cite this article:
Suryaprabha D, Satheeshkumar J, Seenivasan N. Classical and Fuzzy Based Image Enhancement Techniques for Banana Root Disease Diagnosis: A Review and Validation. Orient.J. Comp. Sci. and Technol; 13(1).
|
Copy the following to cite this URL:
Suryaprabha D, Satheeshkumar J, Seenivasan N. Classical and Fuzzy Based Image Enhancement Techniques for Banana Root Disease Diagnosis: A Review and Validation. Orient.J. Comp. Sci. and Technol; 13(1). Available from: https://bit.ly/3g4onJ9
|
Introduction
The
ability of plants to grow and give healthier growth and sustainable yield of a
plant is directly decided by the root system. It is therefore essential to analyze the root
part of a plant to diagnose disease infection in its earlier stage and to trace
out the possible reasons of low productivity. Normally for diagnosis of
root infestation, farmers send the root samples to subject matter specialists
for inspection. The specialists diagnose root infestation and its intensity by
visual examination followed by lab analysis. However, it is difficult for
growers to reach the specialist for diagnosis and advisory service at all
times. Secondarily, online expert systems are made available from last decade
which provides online advices and solutions for infected crops where the affected root images are
displayed. Growers has to compare the standard image symptom with their field
systems to get advises but sometimes it might be interpreted in a wrong way.
Devising an objective method such as image processing technique can prevent
these complications. Thereby root abnormalities could be automatically
identified to reduce human error and to have an accurate interpretation.
Over
the past few years, several researchers have evaluated the capabilities of
image processing algorithms in agriculture sector for addressing various issues
such as fruit quality analysis, plant species identification, precision
farming, remote sensing, weed recognition and disease diagnosis (Surya prabha and
Satheeshkumar, 2015; Surya prabha et al., 2014). Plant diseases are
great menace for farmers as it reduces both quality and quantity of the crops
productivity. Therefore awareness among farmers has been increased to diagnose
the disease infection in its earlier stage. Camargo & Smith
reported an image processing algorithms to enhance, segment and extract
features from the images of leaf diseases of cotton plants (Surya prabha et al., 2014; Camargo and Smith, 2009a). Camargo and Smith (2009b)
also described image processing based algorithm to segment and extract
diseased region from the images of banana leaf which enabled to identify
diseased region even when that region was represented by a wide range of
intensities. Besides, several authors have reviewed the possible methodologies
and procedures of image processing technique to detect the diseases of crop
plants (Surya prabha et al., 2014).
However, most research pay attention on analyzing the foliar diseases or
symptoms. The diagnosis of plant root disease symptoms using image processing
technique was not attempted earlier.
Success
of root image processing algorithms exclusively depends on the quality of
images. Traditionally roots were washed and cleaned thoroughly to make sure
that the acquired images are of a good quality (Smit et al., 2000). Of late,
researchers started to use real time root images as such without staining while
disease diagnosis. Images
of root captured from real time environment are prone to more noises, dust and
illumination. Image enhancement module of image processing plays a key role to
remove unwanted information of real time images. Hence, image processing
algorithms that are to be developed for the purpose of root analysis should be
initiated by enhancement module to improve the image quality.
Image
enhancement is foremost basic step in image processing application. It is used
to improve the image quality so as to make it clearly understandable for
machine and human perception (Lindenbaum et al., 1994; Chen et al., 2019). Quality of an image determines the
accuracy of information retrieval and interpretation from an image. It is
therefore essential to improve the image quality to its highest standard for
better perception. Generally, enhancement of image quality can be achieved
either by reducing the noise or by adjusting the contrast or by modifying the
brightness in an image. It does not modify the inherent nature of image but it
modifies only the dynamic range of pixels which ascertains the smallest and
highest intensity value in an image (Zhuang et al., 2017). Two main category of image enhancement
techniques are spatial and frequency methods (Surya
prabha et al., 2013). In spatial domain, images are directly
manipulated using their pixel values and alternatively in frequency domain,
images are indirectly manipulated using transformations. The term spatial is a
representation of image plane; comprising of intensity values for each and
every pixel in an image. So, this method
operate directly on each pixel values and these values are enhanced by
performing mathematical manipulations on individual pixels without depending on
other pixels and the methods are termed as point processing methods. Image
negative, power law methods and logarithmic methods are some of the examples of
point processing spatial methods. If each pixel value in an image is enhanced
with the support of its neighbouring pixel values, then the methods are termed
as neighbourhood processing methods. Mean filtering, median filtering and
Gaussian filtering are some of the examples of neighbourhood processing
methods.
Image
enhancement is an important research field where numerous new techniques are
found in the literature but no method can claim that it is best for all type of
images and applications (Starck et al., 2003; Hiary et al., 2017)). Similar to image segmentation, image
enhancement methods are also application specific in nature and is therefore
challenging to choose a relevant enhancement technique (Grigoryan et al.,
2019). Hence, there is high demand for image enhancement algorithms which lead
to the expansion of more application specific enhancement algorithms. In this
paper, different enhancement methods available in the classical point
processing methods and fuzzy based methods are discussed in detail and these
methods are applied over root images to identify the suitable enhancement
method for possible application in banana root disease diagnosis. The performances
of different image enhancement methods over root images were evaluated and
compared using no-reference image quality metrics such as entropy and blind
image quality index.
Classical Point Processing Methods
It is a
simpler and easier technique to enhance the image quality by doing
pixel-by-pixel manipulation in an image. In point operation, a mathematical
equation or operation is applied over each and every pixel point expressed as,1

where, ‘B(s,t)’ is an input image and ‘T’ is a
point operation that is applied over each point in an input image to result
with an enhanced image ‘A(s,t)’. This technique again is broadly classified
into two categories namely, gray level transformations and histogram processing
(Gonzalez et al., 2010). Mapping of each pixel value in an input image to a pixel
value in an output image using a transformation function is termed as intensity
or gray level transformation. Mapping the number of pixel occurrences for a
particular intensity value in an image is termed as histogram. Manipulation
performed on histogram using a discrete function is termed as Histogram
Processing.
Intensity Transformation
Intensity
transformation, also known as gray level transformation, is a function used to
map a pixel value in an input image to a new pixel value in the output image
using transformation function. These gray level transformations are either
linear or non-linear in nature. In linear gray level transformation, it uses a
linear function for mapping pixel values at same location in the images. In
non-linear gray level transformation, it uses a non-linear function for mapping
the pixel values. Image negatives and contrast stretching are some of the
examples of linear gray level transformations. Logarithmic transformation and
power law transformations are some of the examples of non-linear gray level
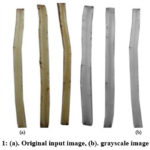
transformations. These intensity transformations are not performed directly in
RGB image color space and during manipulation, the input image in RGB color
space is converted into gray scale color space as in Figure 1 (a & b).
Standard intensity transformation functions used in image enhancement are
discussed in detail in this section.
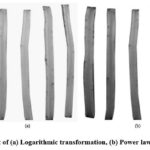
Logarithmic Transformation
Logarithmic
transformation is commonly used for the purpose of compressing or expanding the
dynamic series of pixels in the light or dark regions of an image as in Figure
2(a). Hence, it is required to map lower intensity value with higher range of
grayscale value and higher intensity value with lower range of grayscale
values. Pixel values in an image are transformed or replaced using logarithmic
value of each pixel using the formula,

where ‘c’ is
a scaling constant used for image quantization and ‘a’ is an intensity value of
the original image (I) at a point (m,n). The increase in constant value
increases the image brightness. Therefore it is essential to choose appropriate
constant value for enhancement to avoid ill effects like blurness. The numeric
value ‘1’ is added in the calculation of scaling factor so as to avoid problems
in situations where log value is undefined.
Power Law Transformation
Power law transformation is an alternative to logarithmic transformation. It raises the pixel values in an image to a fixed power and is calculated using,

where ‘K(s,t)’ is the enhanced image, ‘I(s,t)’ is an
input image with ‘c’ and ‘γ’ are positive constants. The constant ‘c’ is used
for scaling purpose and ‘γ’ is the exponent used to improve image contrast.
If gamma value (γ) has value larger than 1 then it
improves the image contrast of light region in an image otherwise it improves
the contrast of dark region in an image. This method is useful to manipulate
the contrast of an image for general purposes as in Figure 2(b). Several image
capturing devices, printers, scanners and monitors uses the concept of power
law for gamma correction which is a correction required on the output of any of
these device for higher display accuracy. Gamma correction is very much useful
for solving the issue of non-linear relationship between voltage, considered as
input, and intensity, considered as output, in a monitor display.
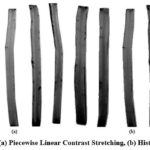
Piecewise Linear Contrast Stretching
This is a commonly used piecewise linear function method where the intensity level range of an image is expanded for normalization and thereby contains dynamic range of value in the resultant output image as in Figure 3(a) (Gonzalez et al., 2010). The input requirement is more in this method when compared with other gray level transformation methods where contrast stretching is given by,

where
‘K(s,t)’ is the output image, ‘I( s,t)’ is the input image with four input
values ‘s’, ‘t’, ‘u’ and ‘v’. Values of ‘x’ and ‘y’ represent the upper and
lower limits of the pixel range that are in use for quantization i.e., x = 255
and y = 0 for an 8-bit image. Values of ‘u’ and ‘v’ represent the maximum and
minimum pixels which are actually present in the image. The value of ‘u’ and
‘v’ is ascertained from input image histogram.
Histogram Processing
Histogram is used to plot the number of frequently
occurring pixel intensities in an image. Horizontal axis of histogram
represents information related to the intensity values in a range of [0–255]
for 8-bit image and vertical axis represents information related to the
frequent occurrences of each intensity value within an image (Gonzalez and Woods, 2011). Enormous information is gathered through histogram
as it provides global information about the image properties including its
appearance and texture. In histogram processing, contrast of an image is
enhanced by doing mathematical manipulations over the histogram. It modifies
the active range of pixel intensities in an image using discrete transformation
function. It is used in different modules of image processing like image
enhancement, image segmentation, image description and image compression and is
mainly helpful in processing the real time images. Histogram equalization,
histogram matching and adaptive histogram equalization are some commonly
available histogram processing methods.
Histogram Equalization
It is a familiar method used to enhance the image contrast by spreading the intensity values evenly in an image. Complete automatic process with simple computational task is the major advantage of this method. The result of enhanced output image is purely dependent on the histogram of input image. It considers variable assigned to intensity values of input image either as continuous or discrete variable. In this method, the acquired input image is remapped or transformed into a new image i.e., the output image using the mapping function,

where ‘A’ is
the intensity values of input image and
‘I’ is the intensity values of output image. ‘f(A)’ must be single value and must increase monotonically which
are the major conditions that determine the validity of mapping. It uniformly
distributes the histogram of input image to obtain an enhanced output image.
This mapping is done using probability density function which assures that the
histogram of output image is equally distributed as in Figure 3(b).
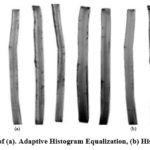
Adaptive Histogram Equalization
Generally, Histogram equalization method is global in
nature and is suitable for situations where the entire image region needs to be
enhanced. It lacks to perform better for local region enhancement in an image.
Histogram of local regions must be manipulated to enhance the required local
region in an image. This process is achieved by adaptive histogram equalization
where the different regions in the image are manipulated through regions local
properties. Sliding window approach is a simple, easier and common method used
to enhance the image using adaptive histogram equalization. It breaks the image
into different small blocks or tiles or windows and these blocks use outer
window to obtain the required histogram equalization. This method is very much
successful and helpful to increase the contrast of local regions as in Figure 4(a).
There is a higher probability for over increase in contrast and occurrence of
block artifacts in an image. To avoid these artifacts, the outer window size is
increased comparatively to the inner window size. In order to restrict the
increase in contrast value within certain limit, Contrast limited adaptive
histogram equalization method is expanded from the adaptive histogram
equalization method for better and efficient enhanced result.
Histogram Matching
Histogram Matching or Histogram Specification is based
on the same principles of histogram equalization. Unlike histogram equalization
where the target histogram distribution is automatic, in this method, the
target histogram distribution is user-specific. This technique is suited in the
situations where the user has knowledge or idea about the regions in input
image that require enhancement. Required histogram shape is specified manually
either by a mathematical function or from an existing reference image with
required histogram distribution as in Figure 4(b).
Fuzzy
image enhancement methods
The
developments and innovations in the concept of fuzzy logic paved its way for
applications in image processing. This concept of fuzzy logic was initially
integrated into image processing by researchers like Prewitt, Pal et al.,
and Rosenfeld (Chaira and Ray, 2016). The pixel values which are the key
constituent in an image are uncertain, imprecise and indeterministic. So during
the development of an automated system for banana fruit quality analysis, the
interpretations based on the crisp set of pixel values might mislead. So the
use of fuzzy logic by considering pixel values as fuzzy in nature would produce
accurate, certain and reliable result. The fuzzy image processing is considered
as a compilation of varied fuzzy approaches with three main stages namely,
fuzzification, modification of membership values and defuzzification. Fuzzy set
concept is applied in numerous modules of image processing like image
enhancement, image segmentation and image retrieval. In image enhancement,
contrast of an image is adjusted by modifying the membership values to
transform the original image into enhanced image (Pal and King, 1981). So for
this purpose of adjusting and transforming the pixel values membership function
is applied. There are numerous fuzzy based enhancement methods available in
literature using fuzzy intensification operator, fuzzy if-then rules and fuzzy
expected value and so on. In this section the commonly used fuzzy based
enhancement methods using fuzzy intensification operator and fuzzy if-then
rules are discussed in detail.
Image enhancement using fuzzy if-then
rules
Fuzzy
rule based methods are very useful even for problems that are non-linear in
nature. It is tedious to define deterministic criteria for enhancing an image.
This task has been made simpler using the fuzzy approach. It is based on the simple classical rule
system – “if (specific condition) then (specific action)”. Specific rules are
defined for the pixels in an image for enhancement (Li and Yang, 1989). These
rules or conditions are formed by considering the gray level pixel value in an
image. Based on these conditions decisions are made individually and then it is
combined together to make a final decision. In a simple fuzzy if-then system,
the maximum, minimum and mid gray levels of an image is calculated. As a
fuzzification process, the membership values are assigned for the different
(dark, gray and bright) regions of an image. Then a fuzzy inference is done to
modify the membership functions in an image. As a consequence of inference
mechanism, the pixel values of different regions with dark, gray and white is
transformed into black, gray and white. Then using the inverse of
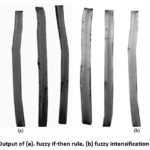
fuzzification, the result of inference system is defuzzified (Figure 5.a.).
Image enhancement using fuzzy
intensification operators
In this fuzzy method of image enhancement, contrast of an image is improved by using fuzzy intensification operator (Figure 5.b.). As this method depends mostly on the gray levels of an image, the gray scale image is considered as a single fuzzy set (Hanmandlu et al., 2003; Hanmandlu and Jha, 2006). The membership function for this fuzzy set is defined as

where “Imax” and “Imin” are the maximum and minimum gray levels in an image, ‘I’, ‘x’ and ‘y’ are the pixel co-ordinate points for image location (x,y), ‘d’ and ‘e’ are the fuzzifiers used to control the uncertain amount of grayness in an image.
In this method, pixel values are darker when the membership value is less than 0.5 and pixel values are brighter when the membership value is greater than 0.5. The main objective of this method is to reduce the fuzziness in an image (Surya prabha and Satheeshkumar, 2016a). Image with low contrast has more fuzziness in the image fuzzy set and to increase the contrast of image, the fuzziness must be reduced. So the intensification operator for the set is defined as
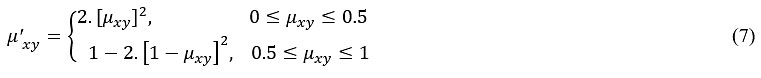
After modifying the membership function, the modified values are transformed into the spatial domain using an inverse function.

Performance Evaluation
The
root images were collected from 20 banana plants at Sirumugai
village, Coimbatore District, Tamil Nadu, India. The root samples
taken from banana plant were split vertically into two halves in such a way to
visualize any damage or infection on roots as per INIPAB root damage assessment
guidelines (Carlier et al., 2003). Performance of the spatial based enhancement methods was
evaluated over ten real time banana root images. Under classical enhancement
methods, different point processing methods
such as contrast stretching, lograthmic
transformation, power law transformation, histogram equalization, adaptive
histogram equalization and histogram matching; and fuzzy based
enhancement methods using fuzzy intensification operator and fuzzy if-then
rules were used to enhance the banana root images.
The enhanced output attained through different classical point
processing methods and fuzzy based methods must be analyzed and evaluated. The
performance of enhancement methods are assessed either by using qualitative or
quantitative assessment methods. The qualitative method of evaluation is based
on human judgments and faces challenges like human bias, cost and time
consumption and unreliability. So it preferred to use the quantitative method
of assessment for evaluating the performance of different enhancement methods.
As the data set is real time in nature and has no ground truth image,
no-reference image quality method is suitable for assessment. Shannon entropy
and blind image quality index are the two no-reference image quality metric
used in this paper.
Entropy
Shannon entropy measures the uncertainty or information in an image (Surya prabha and Satheeshkumar, 2016b). It is a classical method of evaluation used for no-reference image data sets. The concept of this method has been taken from information theory and is calculated using,

where ‘e’ denotes pixels frequency and ‘a’ denotes intensity value of pixel. Entropy with lower value have less uncertainty in an image and entropy with higher value have more uncertainty in an image.
Blind Image
Quality Index (BIQI)
Blind
image quality assessment measures the anisotropy value in an image using renyi
entropy and normalized pseudo-Wigner distribution (Gabarda and Cristobal,
2007). BIQI calculates the expected entropy variance value based on the spatial
frequency distribution (pixel-by-pixel) from a set of predefined directions in
an image and generates entropy histogram. The spatial frequency distribution is
calculated as a discrete approximation for a probability density function. The
discrete approximation is calculated using the Wigner distribution for the
selection of directionality for variance calculation. Hence, the normalized
Pseudo-Wigner distribution is used for extracting the spatial frequency
distribution in an image.
The renyi entropy is defined for discrete space-frequency distribution F[x, y] as

where
‘x’ is the spatial variable and ‘y’ is the frequency variable and in general
‘α’ value of 2 is recommended for the space-frequency distribution.
The
variance value calculated from renyi entropy is considered as the
directionality function and is used as anisotropy indicator. This method is
very much useful to assess the quality of real time images. Blind Image Quality
Index (BIQI) with higher value indicates the better performance of the method
and with lower value indicates poor performance of the method.
Analysis of Data Sets
Entropy and BIQI was calculated for the enhanced
images achieved through different enhancement techniques. The data sets of Entropy and BIQI obtained from contrast stretching, logarithmic transformation, power law
transformation, histogram equalization, adaptive histogram equalization,
histogram matching, fuzzy intensification operator and fuzzy if-then
rules methods were statistically analyzed. Analysis of variance
(ANOVA) with Tukey’s HSD multiple range tests was used to compare the
significance of datasets of different enhancement methods. The software
used for statistical analysis was IRRISTAT version 92 developed by
International Rice Research Institute Biometrics unit, Philippines (Panse
and Sukhatme, 1989).
Results and Discussion
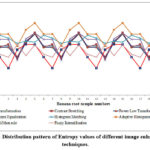
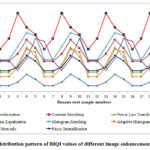
The
results of Entropy and BIQI values for
different image enhancement methods are shown in Figure 6 and Figure 7. The fuzzy if-then rules methods recorded less entropy values (3.89 – 4.66) and high BIQI values (0.025 – 0.046). Adaptive Histogram Equalization
technique recorded the high entropy values (4.62 – 5.38) where as Logarithmic
Transformation recorded the least BIQI values
(0.003 – 0.010).
The average Entropy and BIQI values for different image enhancement methods are shown in
Figure 8 and Figure 9. Statistical analysis of variance revealed that there was
significant differences among the eight different image
enhancement techniques in entropy (F
= 7.30; df = 7, 72; P ≤ 0.001) and
BIQI (F = 19.7; df = 7, 72; P ≤ 0.001). Entropy is significantly
lower (4.40) in fuzzy if-then rules techniques
than all other methods evaluated. Adaptive Histogram
Equalization techniques had significantly high mean entropy values (5.03). BIQI value was lowest for the Logarithmic Transformation (0.005). BIQI value was significantly higher for fuzzy
if-then rules method (0.347). The results clearly indicated that the fuzzy
if-then rules method is best method among different image
enhancement techniques to enhance the banana root
images (Figure 10).
The
performance of these image inhancement methods with standard data set (CSIQ)
were also compared in our earlier study and showed that fuzzy if-then rules
method is better than other methods (Prabha, 2018). Also our earlier study demonstrated
that performance of image enhancement by fuzzy if-then rules method improved
the classification accuracy of leaf disease image sets significantly.
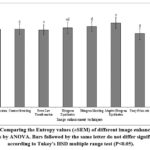 |
Figure 8: Comparing the Entropy values (±SEM) of different image enhancement techniques by ANOVA. Bars followed by the same letter do not differ significantly according to Tukey’s HSD multiple range test (P<0.05).
Click here to View figure
|
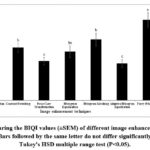 |
Figure 9: Comparing the BIQI values (±SEM) of different image enhancement techniques by ANOVA. Bars followed by the same letter do not differ significantly according to Tukey’s HSD multiple range test (P<0.05).
Click here to View figure
|
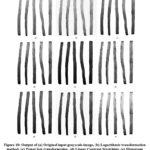 |
Figure 10: Output of (a) Original input grayscale image, (b) Logarithmic transformation method, (c) Power law transformation, (d) Linear Contrast Stretching, (e) Histogram Equalization, (f). Adaptive Histogram Equalization, (g) Histogram Matching, (h). Fuzzy if-then rule method, (i) Fuzzy intensification operator method
Click here to View figure
|
Conclusion
Numerous
algorithmic approaches are available to modify and adjust the acquired images
to make them have better human interpretation and visual understanding. Plant root disease diagnosis using real time images is
one of the thrust areas in agriculture sector. This paper reviewed
various spatial domain image enhancement techniques existing in literature that
can be exploited for improving quality of root images. This study compared
different classical point processing methods (contrast
stretching, logarithmic transformation, power law transformation, histogram
equalization, adaptive histogram equalization and histogram matching) and fuzzy
based methods for real time banana root images. Performance of all
methods was evaluated using entropy and blind image quality index. Results
revealed that fuzzy based if-then rule method is
performing better to improve the banana root image quality. This technique is
effective in eliminating the noise, preserving image boundaries and fine
details. Hence enhancement of banana root images by fuzzy if-then rule based
method will improve the accuracy for further steps of image segmentation,
feature extraction and classification while devising the banana root disease
diagnosis process.
References
- Camargo,
A., Smith, J.S. (2009). An image-processing based algorithm to automatically
identify plant disease visual symptoms. Biosyst. Eng., 102, 9-21.
- Camargo,
A., Smith, J.S. (2009). Image pattern classification for the identification of
disease causing agents in plants. Comput. Electron Agric., 66, 121–125.
- Carlier,
J., De Waele, D., Escalant, J., Vezina, A., Picq, C. (2003). Global evaluation
of Musa germplasm for resistance to Fusarium
wilt, Mycosphaerella leaf spot diseases and nematodes:
Performance evaluation. INIBAP Technical Guidelines.p. 57. Montpellier,
France: INIBAP.
- Chaira,
T., Ray, A.K. (2016). Fuzzy image
processing and applications with MATLAB.p. 237. Finland: CRC Press. 2016.
- Chen, Y., Yu, M., Jiang, G., Peng, Z., Chen, F.
2019. End-to-end single image enhancement based on a dual network cascade
model. Journal of Visual Communication and Image Representation, 61, 284-295.
- Gabarda,
S., Cristóbal, G. (2007). Blind image quality assessment through anisotropy. J Optical Soc. Am., 24,
32-51.
- Gonzalez, C.R.,
Woods, R.E. (2011).Digital image processing. P. 976.India: Dorling Kindersley
(India) Pvt Lt Publications.
- Gonzalez, C.R.,
Woods, R.E., Eddins, S.L. (2010). Digital image processing using MATLAB. P.
578. India:Tata McGraw-Hill Publications.
- Grigoryan, A.M., Agaian, S.S. 2019. Gradient
based histogram equalization in grayscale image enhancement. In Mobile
Multimedia/Image Processing, Security, and Applications 2019 (Vol.
10993, p. 109930O). International Society for Optics and Photonics.
- Hanmandlu, M., Jha, D. (2006).An optimal
fuzzy system for color image enhancement. IEEE
Trans. Image Process., 15, 2956-2966.
- Hanmandlu,
M., Jha, D., Sharma, R. (2003).Color image enhancement by fuzzy
intensification. Pattern Recognition
Letters, 24, 81–87.
- Hiary,
H., Zaghloul, R., Al-Adwan, A., Moh’d B, A. Z. 2017. Image contrast enhancement
using geometric mean filter. Signal, Image and Video Processing, 11(5),
833-840.
- Li, H., & Yang, H.S. (1989). Fast and
reliable image enhancement using fuzzy relaxation technique. IEEE Trans Syst. Man Cybernatics, 19,
1276-1281.
- Lindenbaum, M., Fischer, M., &Bruckstein, A.
(1994).On Gabor’s contribution to image enhancement. Pattern Recognition, 27, 1-8.
- Pal, S.K., King, R. (1981).Image
enhancement using smoothing with fuzzy sets. IEEE Trans on Syst. Man
Cybernatics, 11, 494-500.
- Panse,
V.G., Sukhatme, P.V. (1989).Statistical
methods for Agricultural Workers.p 359. New Delhi, India: ICAR.
- Prabha,
D.S. 201). Development of an efficient model for banana grading and crop disease
analysis using optimized image enhancement and segmentation algorithms. PhD
Thesis submitted to Bharathiar University, Tamil Nadu, India.
- Smit, L.A.,
Bengough, A.G., Engels, C.,. Van
Noordwijk, M., Pellerin, S., Van De Geijn, S.C. (2000). Root
Methods:A Handbook. P. 587.Heidelberg:SpringerVerlag.
- Starck, J.L., Murtagh, F., Candes, E.J., Donoho, D.L. (2003).Gray and Color Image
Contrast Enhancement by the Curvelet Transform. IEEE Trans. Image Process., 12, 706-717.
- Surya
prabha, D., Satheeshkumar, J. (2013).Three dimensional object
detection and classification methods: a study, Int. J. Eng. Res. Sci.
Technol., 2, 33–42.
- Surya
prabha, D., Satheeshkumar, J. (2014).
Crop disease identification using image processing methods, In. Green Computing,
India:Hikey
Media, pp.
174-179.
- Surya prabha, D., Satheesh kumar, J.
(2015). Assessment of banana fruit
maturity by image processing technique. J. Food Sci. Technol., 52(3),
1316-1327.
- Surya prabha, D., Satheesh kumar, J.,
Gokulakrishnan, R. 2014. A survey on
applications of image processing methods in agricultural sector. In International Conference on Convergence
Technology, 4, 997-999.
- Surya prabha, D., Satheeshkumar, J.
(2016a). An efficient image contrast enhancement algorithm using genetic algorithm
and fuzzy intensification operator. Wireless
Personal Commun., DOI: 10.1007/s11277-016-3536-x.
- Surya
prabha, D., Satheeshkumar, J. (2016b).
Performance Evaluation of Image Segmentation using Objective
Methods. Indian J. Sci. Technol., 9, 1-8.
- Zhuang, P., Fu, X., Huang, Y., Ding, X. 2017. Image enhancement using divide-and-conquer strategy. Journal of Visual Communication and Image Representation, 45, 137-146.

This work is licensed under a Creative Commons Attribution 4.0 International License.