INTRODUCTION
‘A graph is a pair G = (V, E); where V is the set of all vertices and E the set of all edges; and the elements of E are subsets of V containing exactly 2 elements’.G is called a labeled graph if each edge e=UV is given the value f (UV) = f (u)*f (v), where * is a binary operation. In literature one can find * to be either addition, multiplication, modulo addition or absolute difference, modulo subtraction or symmetric difference [20]. Network representations play an important role in many domains of computer science, ranging from data structures and graph algorithms, to parallel and distributed computing, and communication networks Traditional network representations are usually global in nature. That is, in order to retrieve useful information, one must access a global data structure representing the entire network. Massive graphs are every where, from social and communication networks to the World Wide Web. The geometric representation of the graph structure imposed on these data sets provides a powerful aid to visualizing and understanding the data.
The odd graceful labeling is one of the most widely used labeling methods of graphs [18]. While the labeling of graphs is perceived to be a primarily theoretical subject in the field of graph theory and discrete mathematics, it serves as models in a wide range of applications as listed below.
The coding theory: The design of certain important classes of good non periodic codes for pulse radar and missile guidance is equivalent to labeling the complete graph in such a way that all the edge labels are distinct. The node labels then determine the time positions at which pulses are transmitted.
The x-ray crystallography: X-ray diffraction is one of the most powerful techniques for characterizing the structural properties of crystalline solids, in which a beam of X-rays strikes a crystal and diffracts into many specific directions. In some cases more than one structure has the same diffraction information. This problem is mathematically equivalent to determining all labeling of
the appropriate graphs which produce a pre specified set of edge labels.
The communications network addressing: A communication network is composed of nodes, each of which has computing power and can transmit and receive messages over communication links, wireless or cabled. The basic network topologies are include fully connected, mesh, star, ring, tree, bus. A single network may consist of several interconnected subnets of different topologies. These issues are discussed briefly in this paper.
Networks are further classified as Local Area Networks (LAN), e.g. inside one building, or Wide Area Networks (WAN), e.g. between buildings. It might beuseful to assign each user terminal a “node label,” subject to the constraint that all connecting “edges” (communication links) receive distinct labels. In this way, the numbers of any two communicating terminals automatically specify (by simple subtraction) the link label of the connecting path; and conversely, the path label uniquely specifies the pair of user terminals which it interconnects.
III ROLE OF GRAPH LABELING
Here several applications are listed out. For each kind of application, depending on problem scenario a kind of graph is used for representing the problem. A suitable labeling is applied on that graph in order to solve the problem. Starting from establishing fast, efficient communication various issues are discussed.
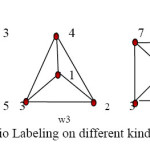
3.1 Fast Communication in sensor networks Using Radio Labeling
Given a set of transmitters, each station is assigned a channel (a positive integer) such that interference can be avoided. The smaller the distance between stations is, the stronger the interference becomes, and hence the difference in channel assignment
has to be greater. Here each vertex represents a transmitter and any pair of vertices connected through an edge corresponds to neighboring transmitters. Here the kind of labeling used is Radio labeling which is defined as Let G = (V (G),E(G)) be a connected graph and let d(u, v) denote the distance between any two vertices in G. The maximum distance between any pair of vertices is
called the diameter of G denoted by diam (G). A radio labeling (or multilevel distance labeling) for G is an
injective function f: V (G) N union {0} such that for any vertices u and v, |f (u) −f (v)| >=diam (G) − d (u, v)+1
For Any application applied radio labeling process proved as an efficient way of determining the time of communication for sensor networks.
Here the network is considered as chain graph in which every sensor planted in the network is a vertex communicating at time t, where t is radio channel assignment. It was found that the random dump of junk in the network then the radio labeling has the property of having “consecutive” channel assignments – close time frames far away from each other. Channel labeling can be
used to determine the time at which sensor communicate.
3.2 Designing Fault Tolerant Systems with Facility Graphs
In this application the network is represented in the form of a facility graph. A facility graph is a graph G
whose nodes represent system facilities and whose edges represent access links between facilities. A facility here is
said to be a hardware or software components of any system that can fail independently. Hardware facilities
include control units, arithmetic processors, storage units and input/output equipments. Software facilities include compilers, application programs, library routines, operating systems etc. Since each facility can access some other facilities, the real time systems are represented as a facility graph.
Facility types are indicated by numbers in parentheses which is termed as graph vertex labeling. The graph indicates the types of facilities accessed by other facilities. The node x1 accesses the nodes x2 and x4. Similarly, the node x5 with facility type t1 access the facility types t3, t1 and t2 of nodes x3, x2 and x4 respectively. In this facility graph when ever any node
fails no need to worry about the communication link because here the facility graph find out another path and communication process done as well as before.
3.3 Automatic channel allocation for small wireless local area network.
To find an efficient way, safe transmissions are needed in areas such as Cellular telephony, Wi-Fi, Security systems and many more. It is unpleasant being on the phone and getting someone else on the same line. This inconvenience is given by interferences caused by unconstrained simultaneous transmissions. Two close enough channels can interfere or resonate thereby
damaging communications. The interference can be avoided by means of a suitable channel assignment.
The channel assignment problem is the problem to assign a channel – nonnegative integer, to each TV or radio transmitters located at various places such that communication do not interfere. In a graph model of this problem, the transmitters are represented by the vertices of a graph; two vertices are very close if they are adjacent in the graph and close if they are at distance two apart in the graph.
In a private communication the channel assignment problem in which close transmitters must receive different channels and very close transmitters must receive channels that are at least two apart.
This problem is addressed by means of modeling the network wireless LAN in the form of an interface graph and solving it using graph labeling technique.
In interference graph the access points (vertices) are interfering with some other access points in the same region. The graph is called as interference graph, which is constructed by the access points as nodes. An undirected edge is connecting these nodes if the nodes interfere with each other when using the same channel. Now, the channel allocation problem is converted into graph labeling problem i.e. vertex labeling problem.
A vertex coloring function f: v (G) C where C is the set of colors corresponds to the channels on the access points. These channels are preferably non overlapping edges. A labeling algorithm – DSATUR (Degree of Saturation) is used for labeling purpose. The algorithm is a heuristic search i.e. it finds vertices with largest number of differently colored neighbors. If this
subset contains only one vertex it is chosen for labeling. If the subset contains more than one vertex then the labeling is done based on the order of decreasing number of unlabeled neighbors. If more than one candidate vertex is available then the final selection is replaced by a deterministic selection function to select the vertex. The protocol operation is done by identifying the neighbors by means of listening the messages generated by the access points. The protocol operation finishes when a message is rebroadcasted by the access points. After finishing this, the interference graph is constructed and the labeling algorithm is applied. The correspondence between the channels and the graph is that as the channels listen the messages in regular intervals as the same way the labeling algorithm should be kept running at regular intervals.
3.4 Avoiding Stealth Worms by Using Vertex Covering Algorithm
The vertex cover algorithm (Given as input a simple graph G with n vertices labeled 1, 2,…n, search for a vertex cover of size at most k. At each stage, if the vertex cover obtained has size at most k, then stop.) is used to simulate the propagation of stealth worms on large computer networks and design optimal strategies to protect the network against virus attacks in real time. The importance of finding the worm propagation is to hinder them in real time.
The main idea applied here is to find a minimum vertex cover in the graph whose vertices are the routing servers and the edges are the connections between the routing servers. Then an optimal solution is found for worm propagation.
3.5 Analyzing Communication Efficiency in sensor networks with Voronoi Graph
The sensor networks have got variety of applications. Tracking of mobile objects, collection of environmental data, defense applications, health care etc…,
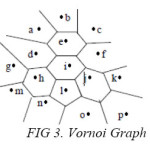
The sensor network is modeled as a graph to analyze the communication efficiency. Here voronoi graph is used to model the sensor network. Because voronoi graph is constructed in a plane in the form of polygons with nodes as the sensors and the Polygon boundaries can be considered as the sensing range of each sensor.
The polygon can be considered as the sensing range of these sensors. Among these sensors one sensor will be the cluster head for reporting function. Two sensors are considered as neighbors if their sensing ranges share a common boundary in the voronai graph.
When the objects cross the boundary of one sensor i.e. the sensing range of one sensor, and enter into the sensing range of another sensor it should be reported to the neighboring sensor properly by the previous sensor.
In the diagram a, b are neighbors. Similarly, e,f; e,d; e,I; are also neighbors. When the objects cross the boundary of one sensor i.e. the sensing range of one sensor, and enter into the sensing range of another sensor it should be reported to the neighboring sensor properly by the previous sensor. Finally the communication efficiency can be increased by taking the above voronoi graph in sensor networks.
3.6 Reducing the Complexity of Algorithms in Compression Networks
Here a large network is considered. Dealing with such huge networks is a complex task in all aspects. In this, graphical summary of the large graphs arising in the domain of enterprise IP networks are created. Domain is rich in large highly engineered graphs. This is done by transforming the original graph into a smaller one using structural features of the graph that have well understood semantics in our domain. This results smaller and usually annotated, graph can then be visualized, and understood by a human being confronted with such a dataset. This process is referred as graph compression or more properly, semantic graph compression, to distinguish it from algorithmic graph compression where a graph is compressed in order to reduce the time or space complexity of a graph algorithm. In Compression Networks a graph is compressed in order to reduce the time or space complexity of a graph algorithm. There are many advantages of creating a communications network. One advantage is that if a link goes out, a simple algorithm could detect which two centers are no longer linked, since each connection is labeled with the
difference between the two communication centers. Another advantage is that this network also would have all the same properties as a graceful graph; such as having cyclic decompositions.
3.7 Graph Labeling in Communication Relevant to Adhoc Networks
Graph labeling can also use for issues in Mobile Adhoc Networks (MANETS). In Adhoc networks, issues such as connectivity, scalability, routing, modeling the network and simulation are to be considered. Since a
network can be modeled as a graph, the model can be used to analyze these issues. Graphs can be algebraically represented as matrices. Also, networks can be automated by means of algorithms. The issues such as node density, mobility among the nodes, link formation between the nodes and packet routing have to be simulated. To simulate these concepts random graph theory is used. Various algorithms are also available to analyze the congestion in MANET’s where these networks are modeled based on graph theoretical ideas.
3.8 Effective Communication in Social Networks by Using Graphs
Social networks are the communication networks that are built around people. Traditional social networks and modern social networks are two such kind.
3.8.1 Traditional social networks
Long before the Internet started to play a role in many people’s lives, sociologists and other researchers from the humanities have been looking at the structure of groups of people. In most cases, relatively small groups were considered, necessarily because analysis of large groups was often not feasible. The traditional networks are used for identifying importance of people or groups.
A person having many connections to other people may be considered relatively important. Likewise, a person at
the center of a network would seem to be more influential than someone at the edge is the disadvantage of these
networks. To overcome the drawbacks of traditional social networks modern social networks are introduced as
online communities.
3.8.2 Online communities
Internet has been the ability to allow people to exchange information with each other by means of userto- user messaging systems. The best known of these systems is e-mail, which has been around ever since the Internet came to life. Another well-known example is network news, through which users can post messages at electronic bulletin boards, and to which others may
subsequently react, leading to discussion threads of all sorts and lengths. More recently instant messaging systems have become popular, allowing users to directly and interactively exchange messages with each other, possibly enhanced with information on various states of presence. Now a day’s almost 2 million e-mail messages were sent every second, by a total of more than 1 billion users are used.
An important contribution to social network analysis came from sociograms. A sociogram can be seen as a graphical representation of a network: people are represented by dots (called vertices) and their relationships by lines connecting those dots (called edges).
It is interesting to see what these communication facilities do to the people who use them. Online communities are used by people who have never met each other physically are sharing ideas, opinions, feelings, and so on. Online community which is dealing here is known as a small world. A small world is characterized by the fact that every two people can reach each other through a chain of just a handful of messages. It is the phenomenon of messages traveling through a network of e-mail users. Users are linked by virtue of knowing each other, and the resulting network exhibits properties of small worlds, effectively connecting every person to the others through relatively small chains of such links. Describing and characterizing these and other networks forms the essence of network science.
3.9 Secure Communication in Graphs
Secure communication in an open and dynamic network in the presence of a malicious adversary can only be achieved when the messages are authenticated. For this purpose authentication channels are used. There are several ways to establish such channels. For example, dedicated communication lines in the network are used here With shared secret keys or public keys.
3.9.1By Using Certificates
The graph with vertices the processors in the network and edges the authentication channels is called a trust graph. If the sender is connected to the receiver by an edge in this graph then the messages can be authenticated through the corresponding channel. Otherwise authentication paths are used through intermediary processors in the trust graph.
Consider the problem of secure communication in a network with malicious faults for which the trust graph, with vertices the processors and edges corresponding to certified public keys, is not known except possibly to the adversary. This scenario occurs in several models. For example, in survivability models in which certifying authorities may be corrupted, or in networks which are being constructed in a decentralized way. A protocol, with which secure communication can be achieved in this case, is provided for the trust graph if sufficiently connected.
3.9.2 By Using Key Graphs
Securing group communications, i.e., providing confidentiality, authenticity, and integrity of messages delivered between group members, will become a critical networking issue. The key graphs are used to specify secure groups. For a special class of key graphs, three strategies for securely distributing rekey messages are provided here after a join/leave and specify protocols for
joining and leaving a secure group. The three strategies are a set of users, a set of keys held by the users, and a user-key relation. By using any of the three rekeying strategies, is scalable to large groups with frequent joins and leaves. In particular, the average measured processing time per join/leave increases linearly with the logarithm of group size.
3.10 Identification of Routing Algorithm with Short Label Names
Informative labeling schemes consist in labeling the nodes of graphs so that queries regarding any two nodes (e.g., whether the two nodes adjacent or not) can be answered by inspecting merely the labels of the corresponding node labels. The main goal of such schemes is to minimize the label size, that is, the maximum number of bits stored in a label. Probabilistic labeling schemes are used to construct various probabilistic one-sided error schemes for the adjacency and ancestry problems on trees. Some of the schemes are significantly improve the bound on the label size of the corresponding deterministic schemes, while the others are matched with appropriate lower bounds showing that, for the resulting guarantees of success, one cannot expect to do much better in term of label size.
3.11Automatic Routing with labeling
In any traditional network if it can be represented with a specific kind of graph topology, then labeling applied may automatically detects route with any additional information.
Here the Graph structure can be anything like cycle, wheel, fan graph, friend graph etc but should be fixed. Now magic labeling can be applied to the network for a magic constant which is public to network. Now the router automatically detects the next node to be reached by using the magic constant, its own label and labels assigned to channels. Since all these must produce a
magic number.
3.11 Security with reducing the packet size using labeling schema
This application requires an agreement in between source and destination in any kind of network. Both of them should hold the kind of labeling. Of course it may not be applied on all packets but majority suits. The information of packet should suitable for the kind of labeling in the agreement.
The information of a packet is applied with labeling and if it is satisfying magic labeling on a particular magic constant (k), than packet consist 1, k, one of the label for each vertex i.e. half of the data can be sent. 1 indicating packet involved labeling; k is magic constant and reaming packet information. As the packet does not hold all bits it provides security also. Only the destination with the information of agreement can retrieve the original information of packet.
With this application the transformation of packet is fast as it involves less size and more secure as it missing some information.
Conclusion
The main aim of this paper is to explore role of Graph Labeling in Communication field. Graph Labeling is powerful tool that makes things ease in various fields of networking as said above. An overview is presented especially to project the idea of Graph Labeling. Researches may get some information related to graph labeling and its applications in communication field and
can get some ideas related to their field of research.
References
- Alexandru Vladoi, “Wireless networks: A labeling problem”, A Senior Project submitted to the Division of Science, Mathematics, and Computing of Bard College.
- S.G.Shirinivas, S.Vetrivel, Dr. N.M.Elango, Applications of graph theory in computer science an overview, International Journal of Engineering Science and Technology Vol. 2(9), 2010.
- Anna C. Gilbert, Kirill Levchenko,” Compressing Network Graphs”, ACM after 2000.
- T. Suel and J. Yuan. Compressing the graph structure of the web. In Proceedings of the IEEE Data Compression Conference, 2001.
CrossRef
- S.Kannan, M. Naor, and S.Rudich. Implicit Representation of Graphs. SIAM J. on Discrete Math5: 596-603, 1992.
CrossRef
- John.P.Hayes, “A graph Model for Fault Tolerant Computing Systems”, IEEE September 1976.
- Narasingh Deo, “Graph theory with applications to engineering and computer science”, Prentice Hall of India, 1990.
- Perri Mehonen, Janne Riihijarvi, Marina Petrova, “Automatic Channel allocation for small wireless area networks using graph coloring algorithm approach”, IEEE 2004.
- Shariefuddin Pirzada and Ashay Dharwadker, “Journal of the Korean Society for Industrial and applied Mathematics, Volume 11, No.4, 2007.
- Pierre Fraigniaud, Amos Korman, “On Randomized Representations of Graphs Using Short Labels”, SPAA 2009.
- Burmester, M., Desmedt, Y., Kabatianskii, G.: Trust and security: A new look at the Byzantine generals ‘problem. In Network Threats, DIMACS, Series in Discrete Mathematics and Theoretical Computer Science, December 2–4, 1996, vol. 38(1998) R. N. Wright and P. G. Neumann, Eds., AMS 274, 275, 276, 277.
- Mike Burmester1, Yvo Desmedt, “Secure Communication in an Unknown Network Using Certificates”, Springer-Verlag Berlin Heidelberg 1999.
- http://www.britinaca.com/bps/additionalcontent/18/3 3373769/concepts-of-graph-theory-relevant-to-Adhoc- Networks.
- Chung Kei Wong, “Secure Group Communications Using Key Graphs”, IEEE/ACM Transactions on networking, vol-8, No. 1, 2000.
- J. J. Tardo and K. Alagappan, “SPX: Global authentication using public key certificates,” in Proc. 12th IEEE Symp. Research in Security and Privacy, May 1991, pp. 232–244.
CrossRef
- Maarten van Steen, “An Introduction to Graph Theory and Complex Networks”, Copyrighted material – January 2010.
- Bondy J. and Murty U. Graph Theory. Springer- Verlag, Berlin, 2008. Cited on 2-24.
- Jacob Yunker, “Graceful Labeling Necklace Graphs”, June 2012.
- pedia.org/wiki/Voronoi_diagram.
- Dr. S.M. Hegde, “Labeled graphs and Digraphs: Theory and Applications”, 12-01-2012 Research Promotion Workshop on IGGA

This work is licensed under a Creative Commons Attribution 4.0 International License.